
How rebalancing can reduce your risk
Volatile financial markets, events in your life, and even regular investment reviews can prompt you to wonder why we rebalance your portfolio. After all, if your strongest-performing assets account for a larger portion of your holdings, why not let them ride?
It all comes down to risk.
Appropriately balancing risk and returns. When we initially drew up your investing plan together, we weighed several factors: Your income, age, and your financial goals, among other things. We built your portfolio based on your unique goals and incorporated some market-return assumptions. The resulting portfolio’s allocation balances the potential returns you’ll need to reach your goals with the risk of potential losses you may incur.
In other words, the purpose of rebalancing isn’t to score the maximum returns possible. The purpose is to manage risk, so your nest egg might fluctuate less in the event of a downturn. The chart below visualizes the concept. Historically, as the percentage of equities in a portfolio has increased, so have the portfolio’s returns. But there’s a trade-off: the higher the percentage of stocks, the greater the risk of losing money.
Historically, higher-return assets have brought increased risk
Best, worst, and average returns for various stock/bond allocations, 1997-2019
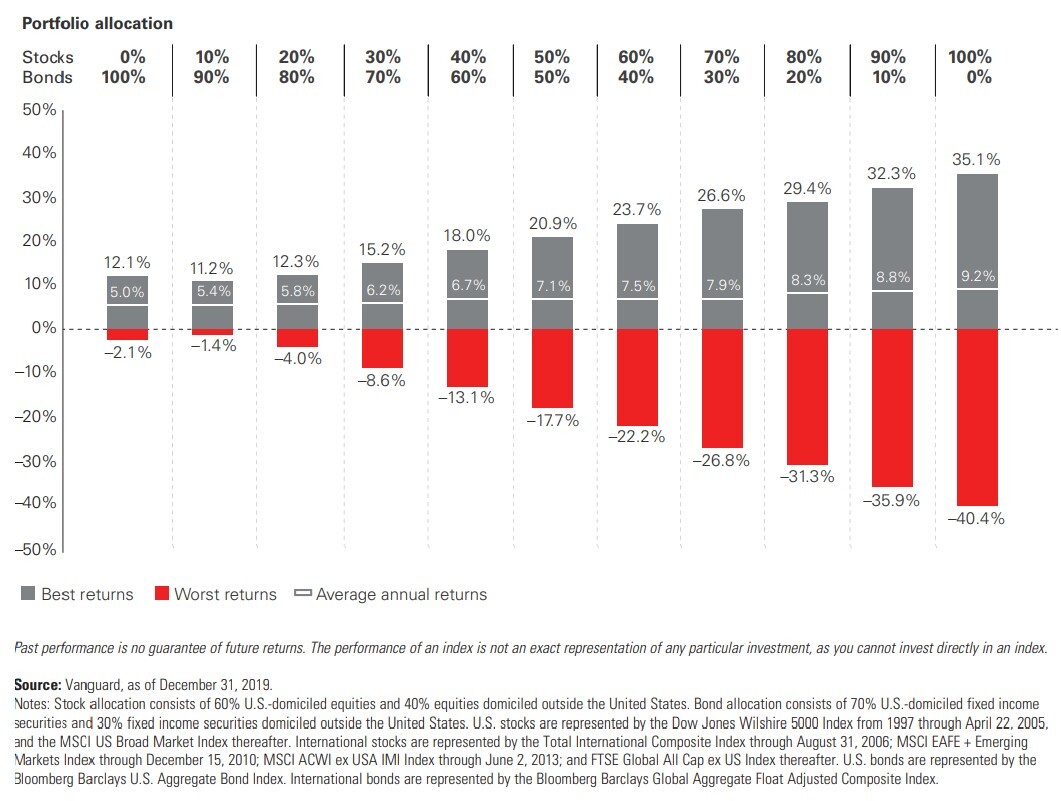
Best, worst, and average returns for various stock/bond allocations between 1997 and 2019. Portfolio allocation: 0% stocks/100% bonds: best return 12.1%, worst minus 2.1%, average 5%. 10% stocks/90% bonds: best 11.2%, worst minus 1.4%, average 5.4%. 20% stocks/80% bonds: best 12.3%, worst minus 4%, average 5.8%. 30% stocks/70% bonds: best 15.2%, worst minus 8.6%, average 6.2%. 40% stocks/60% bonds: best 18%, worst minus 13.1%, average 6.7%. 50% stocks/50% bonds: best 20.9%, worst minus 17.7%, average 7.1%. 60% stocks/40% bonds: best 23.7%, worst minus 22.2%, average 7.5%. 70% stocks/30% bonds: best 26.6%, worst minus 26.8%, average 7.9%. 80% stocks/20% bonds: best 29.4%, worst minus 31.3%, average 8.3%. 90% stocks/10% bonds: best 32.3%, worst minus 35.9%, average 8.8%. 100% stocks/0% bonds: best 35.1%, worst minus 40.4%, average 9.2%.
Past performance is no guarantee of future returns. The performance of an index is not an exact representation of any particular investment, as you cannot invest directly in an index.
Source: Vanguard, as of December 31, 2019.
Notes: Stock allocation consists of 60% U.S.-domiciled outside the United States. U.S. stocks are represented by the Dow Jones Wilshire 5000 Index from 1997 through April 22, 2005, and the MSCI US Broad Market Index thereafter. International stocks are represented by the Total International Composite Index through August 31, 2006; MSCI EAFE + Emerging Markets Index through December 15, 2010; MSCI ACWI ex USA IMI Index through June 2, 2013; and FTSE Global All Cap ex US Index thereafter. U.S. bonds are represented by the Bloomberg Barclays U.S. Aggregate Bond Index. International bonds are represented by the Bloomberg Barlcays Global Aggregate Float Adjusted Composite Index.
One way to think of it: Imagine you’re a baseball manager looking to put together a team. You have a limited number of slots and a finite budget. You could go with a big-name slugger who hits lots of home runs—and commands a hefty contract. Alternatively, you could use that same budget amount to pick up a few less flashy players—who happen to be really consistent at hitting singles and doubles.
Your analysis shows that having a player with a higher on-base percentage in the lineup equates to more wins than having a player with a lot of homers. You could also reduce your risk by spreading out the investment over a few “quality” players rather than just one. So it makes sense for you to sign players who have the potential to get more base hits.
Similar reasoning is at work when you maintain a diverse, balanced portfolio with a disciplined commitment to an established asset allocation—for example, a portfolio made up of 60% stocks and 40% bonds. If you require relatively consistent returns (for instance, if you’re generating income from your portfolio and want that income to remain steady), bonds serve to dampen the market volatility that might otherwise disrupt steady returns.
Notes:
Please remember that all investments involve some risk. Be aware that fluctuations in the financial markets and other factors may cause declines in the value of your account. There is no guarantee that any particular asset allocation or mix of funds will meet your investment objectives or provide you with a given level of income.
Diversification does not ensure a profit or protect against a loss.
Investments in bonds are subject to interest rate, credit, and inflation risk.
Investment products and services are offered through Wells Fargo Advisors Financial Network, LLC (WFAFN), Member SIPC, a registered broker-dealer and a separate non-bank affiliate of Wells Fargo & Company. Wurm & Frye Wealth Management is a separate entity from WFAFN.
Special Offer!
Click below to request your FREE copy of
The Most Common Retirement Mistakes.