
How rebalancing can help your portfolio weather volatility
Watching your portfolio’s returns go up and down can be an emotionally trying experience. Rebalancing to a predetermined, diversified asset mix makes it so you don’t have to worry about market instability as much. When you maintain the appropriate asset allocation, it can serve as a buffer against extreme swings in the market. As a result, you can feel more confident about your portfolio’s ability to potentially preserve value in turbulent markets.
The chart below illustrates the point. Looking to the rightmost column of the chart, clearly the 60% stock, 40% bond (60/40) portfolio does not provide the highest long-term return. But over time, it emerges as being among the top few outperformers.
More consistency through balance
Annual returns by asset class, from the highest to the lowest, 1997–2019
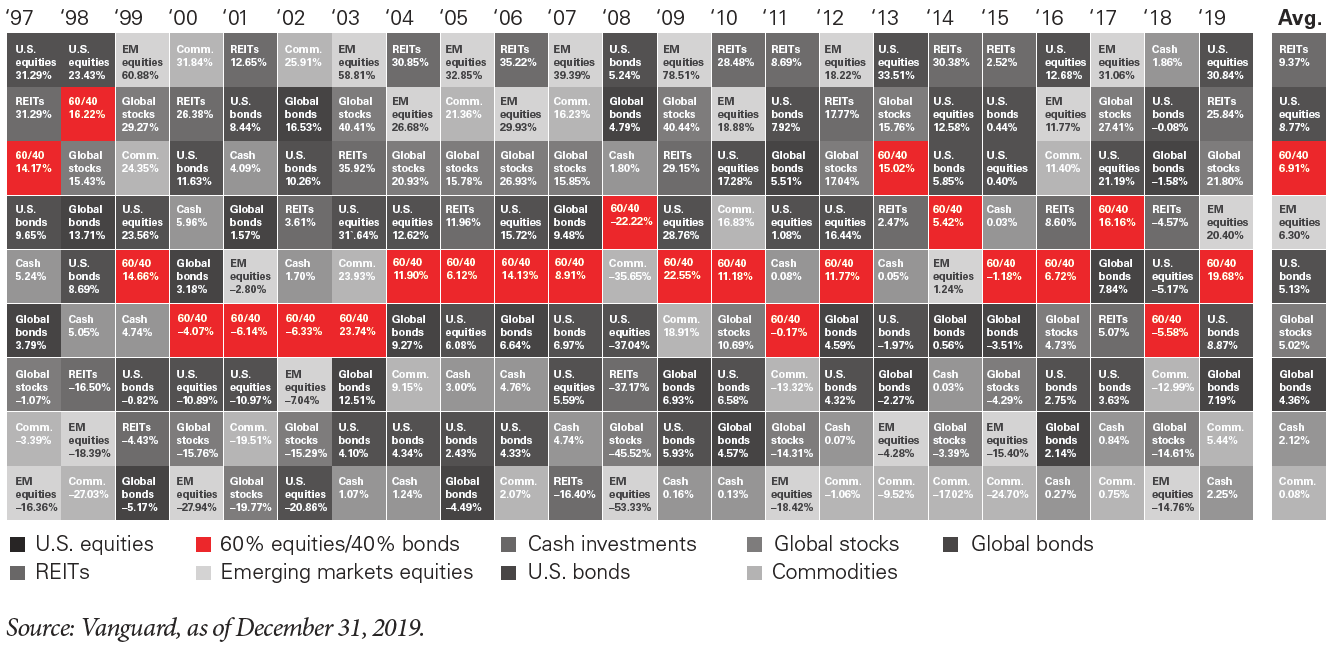
Notes: Cash is represented by the FTSE 3-Month U.S. Treasury Bill Index. REITs are represented by the MSCI US REIT Index adjusted to include a 2% cash position (Lipper Money Market Average) through April 30, 2009; and MSCI US REIT Index thereafter. U.S. equity is represented by the Dow Jones Wilshire 5000 Index through April 22, 2005; MSCI US Broad Market Index through June 2, 2013; and CRSP US Total Market Index thereafter. Emerging markets equity is represented by the Select Emerging Markets Index through August 23, 2006; MSCI Emerging Markets Index through January 9, 2013; FTSE Emerging Transition Index through June 27, 2013; FTSE Emerging Index through November 1, 2015; FTSE Emerging Markets All Cap China A Transition Index through September 18, 2016; and FTSE Emerging Markets All Cap China A Inclusion Index thereafter. U.S. fixed income represented by Bloomberg Barclays U.S. Aggregate Bond Index through December 31, 2009, and Bloomberg Barclays U.S. Aggregate Float Adjusted Index thereafter. Global fixed income represented by Bloomberg Barclays Global Aggregate ex-USD Float Adjusted RIC Capped Index (USD Hedged). Global equity is represented by the Total International Composite Index through August 31, 2006; MSCI EAFE + Emerging Markets Index through December 15, 2010; MSCI ACWI ex USA IMI Index through June 2, 2013; and FTSE Global All Cap ex US Index thereafter. Commodities are represented by the Bloomberg Commodity Index. Composite 60/40 portfolio’s equity allocation consists of 60% U.S.-domiciled stocks and 40% non- U.S. domiciled stocks; bond allocation consists of 70% U.S.-domiciled bonds and 30% non-U.S. domiciled bonds.
But something else very important is happening with that 60/40 portfolio. Historically, when the stock portion wasn’t performing so well, the bond portion typically remained relatively stable (or might even have performed significantly better, depending on the period). This diversification benefit means that bonds may provide some cushion to your portfolio when the stock market hits a rough patch.
Indeed, you can notice in the chart that the 60/40 portfolio doesn’t seem to bounce around as much—that is, exhibit as much volatility—as most of the other asset classes. Many investors feel it’s worth it to accept lower returns in return for a reduced exposure to risk and instability, which helps them sleep better at night.
Let’s say you had two hypothetical portfolios, each consisting of 50% stocks and 50% bonds. One of them you rebalanced regularly. The other you allowed to “drift,” by not rebalancing. Over the course of 30 years, the rebalanced portfolio would have nearly 30% less median volatility than the untended one.1 For people close to their financial goals or who just don’t like risk, this can be meaningful.
If you have questions, we can talk about your portfolio’s asset allocation and the rebalancing methodology we use to keep it on track.
1 Yan Zilbering, Colleen M. Jaconetti, and Francis M. Kinniry Jr., 2015. Best practices for portfolio rebalancing. Valley Forge, Pa.: The Vanguard Group.
Investment products and services are offered through Wells Fargo Advisors Financial Network, LLC (WFAFN), Member SIPC, a registered broker-dealer and a separate non-bank affiliate of Wells Fargo & Company. Wurm & Frye Wealth Management is a separate entity from WFAFN.
Special Offer!
Click below to request your FREE copy of
The Most Common Retirement Mistakes.